# External Libraries
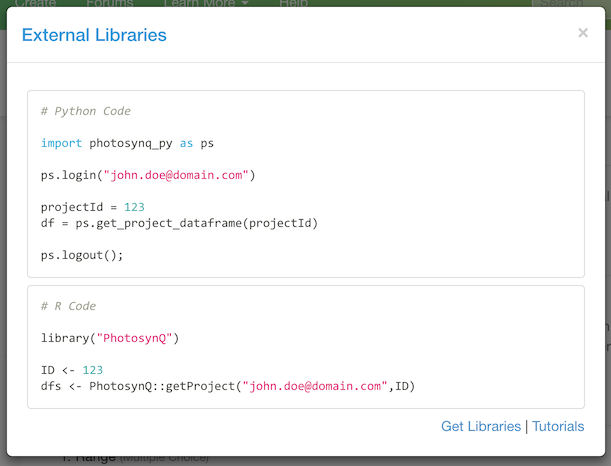
PhotosynQ offers you External Libraries for Python (opens new window) and R-Project (opens new window). To get started, install the library for the language you are using. Then navigate to your Project page. Select External Libraries from the download options which brings up a dialog with code examples for Python and R. Simply copy the code into your script to generate a data-frame. Your email address and Project ID are already included, so you can execute the code right away.
# Python
# Installation
Make sure you have Python (opens new window) (2.7+ or 3.3+) and pip (opens new window) installed. Use the following command in your terminal to install the Library.
pip install git+https://github.com/Photosynq/PhotosynQ-Python.git --upgrade --no-cache-dir
After you installed the library, you can start accessing the data directly from PhotosynQ.
# Accessing Project Data
To access the data from a Project you just need a PhotosynQ Account and the Project ID. You can find the Project ID in the sidebar of the Project Page and in the list of Projects on your User page.
The following simple script can be used to generate a data-frame containing the project data.
import photosynq_py as ps

# use your photosynq account to login (you will be prompted for your password)
email = "john.doe@domain.com"
ps.login(email)

# retrieve a dataframe with data from the given project ID
projectId = 1556
df = ps.get_project_dataframe(projectId)

# logout
ps.logout();
When you run the script you will be prompted to enter your PhotosynQ password. It will not be saved and needs to be entered again, if you re-run the script. The variable df represents the data-frame, generated by the library using pandas (opens new window).
# The Data-Frame
The object returned is a dictionary of data-frames. You can select a frame by using the Protocol name. If multiple Protocols were used, multiple data-frames are available, one for each Protocol.
Dictionary of n
  Dictionary['Protocol Name'] (DataFrame):
    'datum_id': int64
    'time':     int64
  ..
The dataset contains flagged data as well, so when you analyze your dataset you might want to filter out the flagged data points.
protocol = 'Protocol name'
dt_filtered = df[( df[protocol]['status'] == 'submitted')]
Tip
Please find more information about functions in this library on GitHub (opens new window)
# R (R-Studio)
# Installation
Make sure you have R (opens new window) installed. We recommend using it in combination with R-Studio (opens new window). Then run the following two commands in the R-Console.
## Makes the developer tools avaialble
library(devtools)

## Install the PhotosynQ package from GitHub
devtools::install_github("PhotosynQ/PhotosynQ-R")
Please find more options for installing the R package here (opens new window).
# Accessing a Project
To access data from a Project, you need an authorized PhotosynQ Account and the Project ID. You can find the Project ID on the Project page.
The following simple script can be used to generate a data-frame containing the project data and viewing the data from the data-frame.
# retrieve a dataframe with data from the given project ID
ID <- 1556
df <- PhotosynQ::getProject("john.doe@domain.com",ID)

# View the Protocol Data
View(df$`Protocol Name`)
When you run the script you will be prompted to enter your PhotosynQ password. It will not be saved and needs to be entered again, if you re-run the script. The variable df represents the data-frame.
# The Data-Frame
The object returned is a list of data-frames. You can select a frame by using the Protocol name. If multiple Protocols were used, multiple data-frames are available, one for each Protocol.
List of n
 $ Protocol Name:'data.frame':
  ..$ datum_id      : num [1:n] 335742 335741 ...
  ..$ time          : Factor w/ n levels "2016-07-12 12:21:14",..: 175 ...
  ..
The dataset contains flagged data as well, so when you analyze your dataset you might want to filter out the flagged data points.
# Library to make the filter function available
library(dplyr)

# Filter out flagged data
df_filtered <- filter(df$`Protocol Name`, status == "submitted")
Tip
Please find more information about functions in this library on GitHub (opens new window)