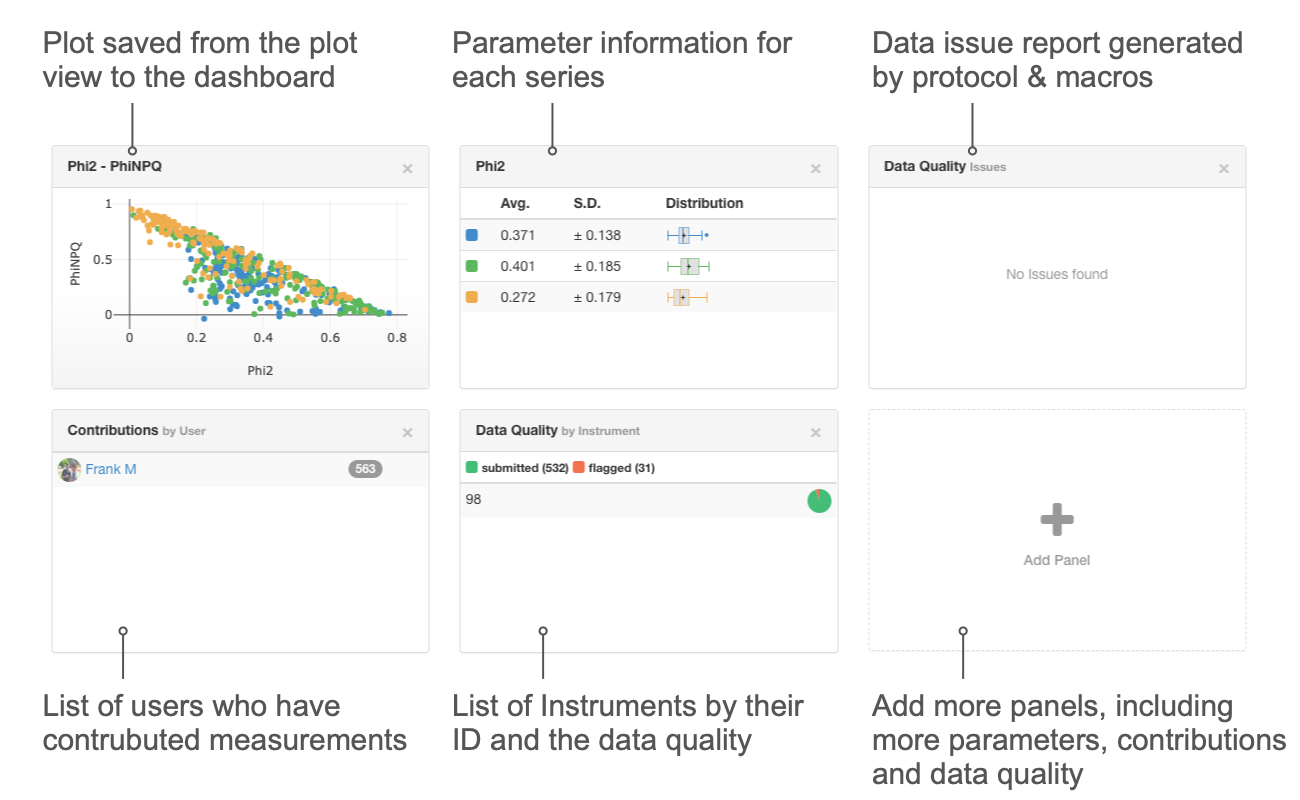
# The Dashboard
The dashboard can show a number of Panels showing what is important to you. You can drag and rearrange panels as you like. Click on the big + to bring up the panel selection dialog, or add plots from the plot view. For each Project an individual Dashboard can be created.
Tip
Next time you view the Project data, your dashboard will be restored.
Issue
When the dashboard is empty, and is not showing any data, make sure you have data selected to be displayed.
# Plots
You can plot parameters against each other using the plot tool.
- In the menu bar above the plot select Dashboard
- Enter a name or use the suggested and click on OK to add the plot to your dashboard.
Tip
You can click on panels with plots to load the plot into your plot view.
# Measurements
| Panel | Function |
|---|---|
| Parameter Average | Show average and distribution for the selected parameter |
| Contributions | Show user contributions in total and for the last 30 days |
Tip
A click on a Parameter Average Panel will bring up the statistics summary for each Series.
# Quality Control - Flagged Data
| Panel | Function |
|---|---|
| Instrument | Flagged and un-flagged data points per Instrument |
| User | Flagged and un-flagged data points per user |
Tip
These panels can help you identifying issues with a user, Instrument or with the approach in general in which measurements are taken.