# The Spreadsheet
The spreadsheet allows you to view and download the data in the familiar spreadsheet layout.
# View the Spreadsheet
Just select the Spreadsheet from the right menu underneath the Project name.
# Protocols
Here you can find the different Protocols used in your Project. If you only use one Protocol ignore this, but if you have
multiple Protocols or you imported additional data, use the dropdown to select data for a specific protocol.
- Select Protocols from above the spreadsheet.
- Pick the protocol you want to view.
- Select More from above the spreadsheet to select additional information including Users, Device IDs, Notes, Photos, Location and Status (e.g. flagged).
Tip
When you add additional data to your measurements later on, the additional data will be available as Imported Data (Custom Data).
# More
Select additional data you want to include into the spreadsheet by checking the boxes. Close the menu by clicking somewhere
outside of the dropdown. The spreadsheet is then updated and the columns with the additional information are appended to the
end. The additional information includes Users, Device IDs, Notes, Photos, Location and Status (e.g. flagged).
Tip
The settings are not saved so next time you open this page you have to make these selections again.
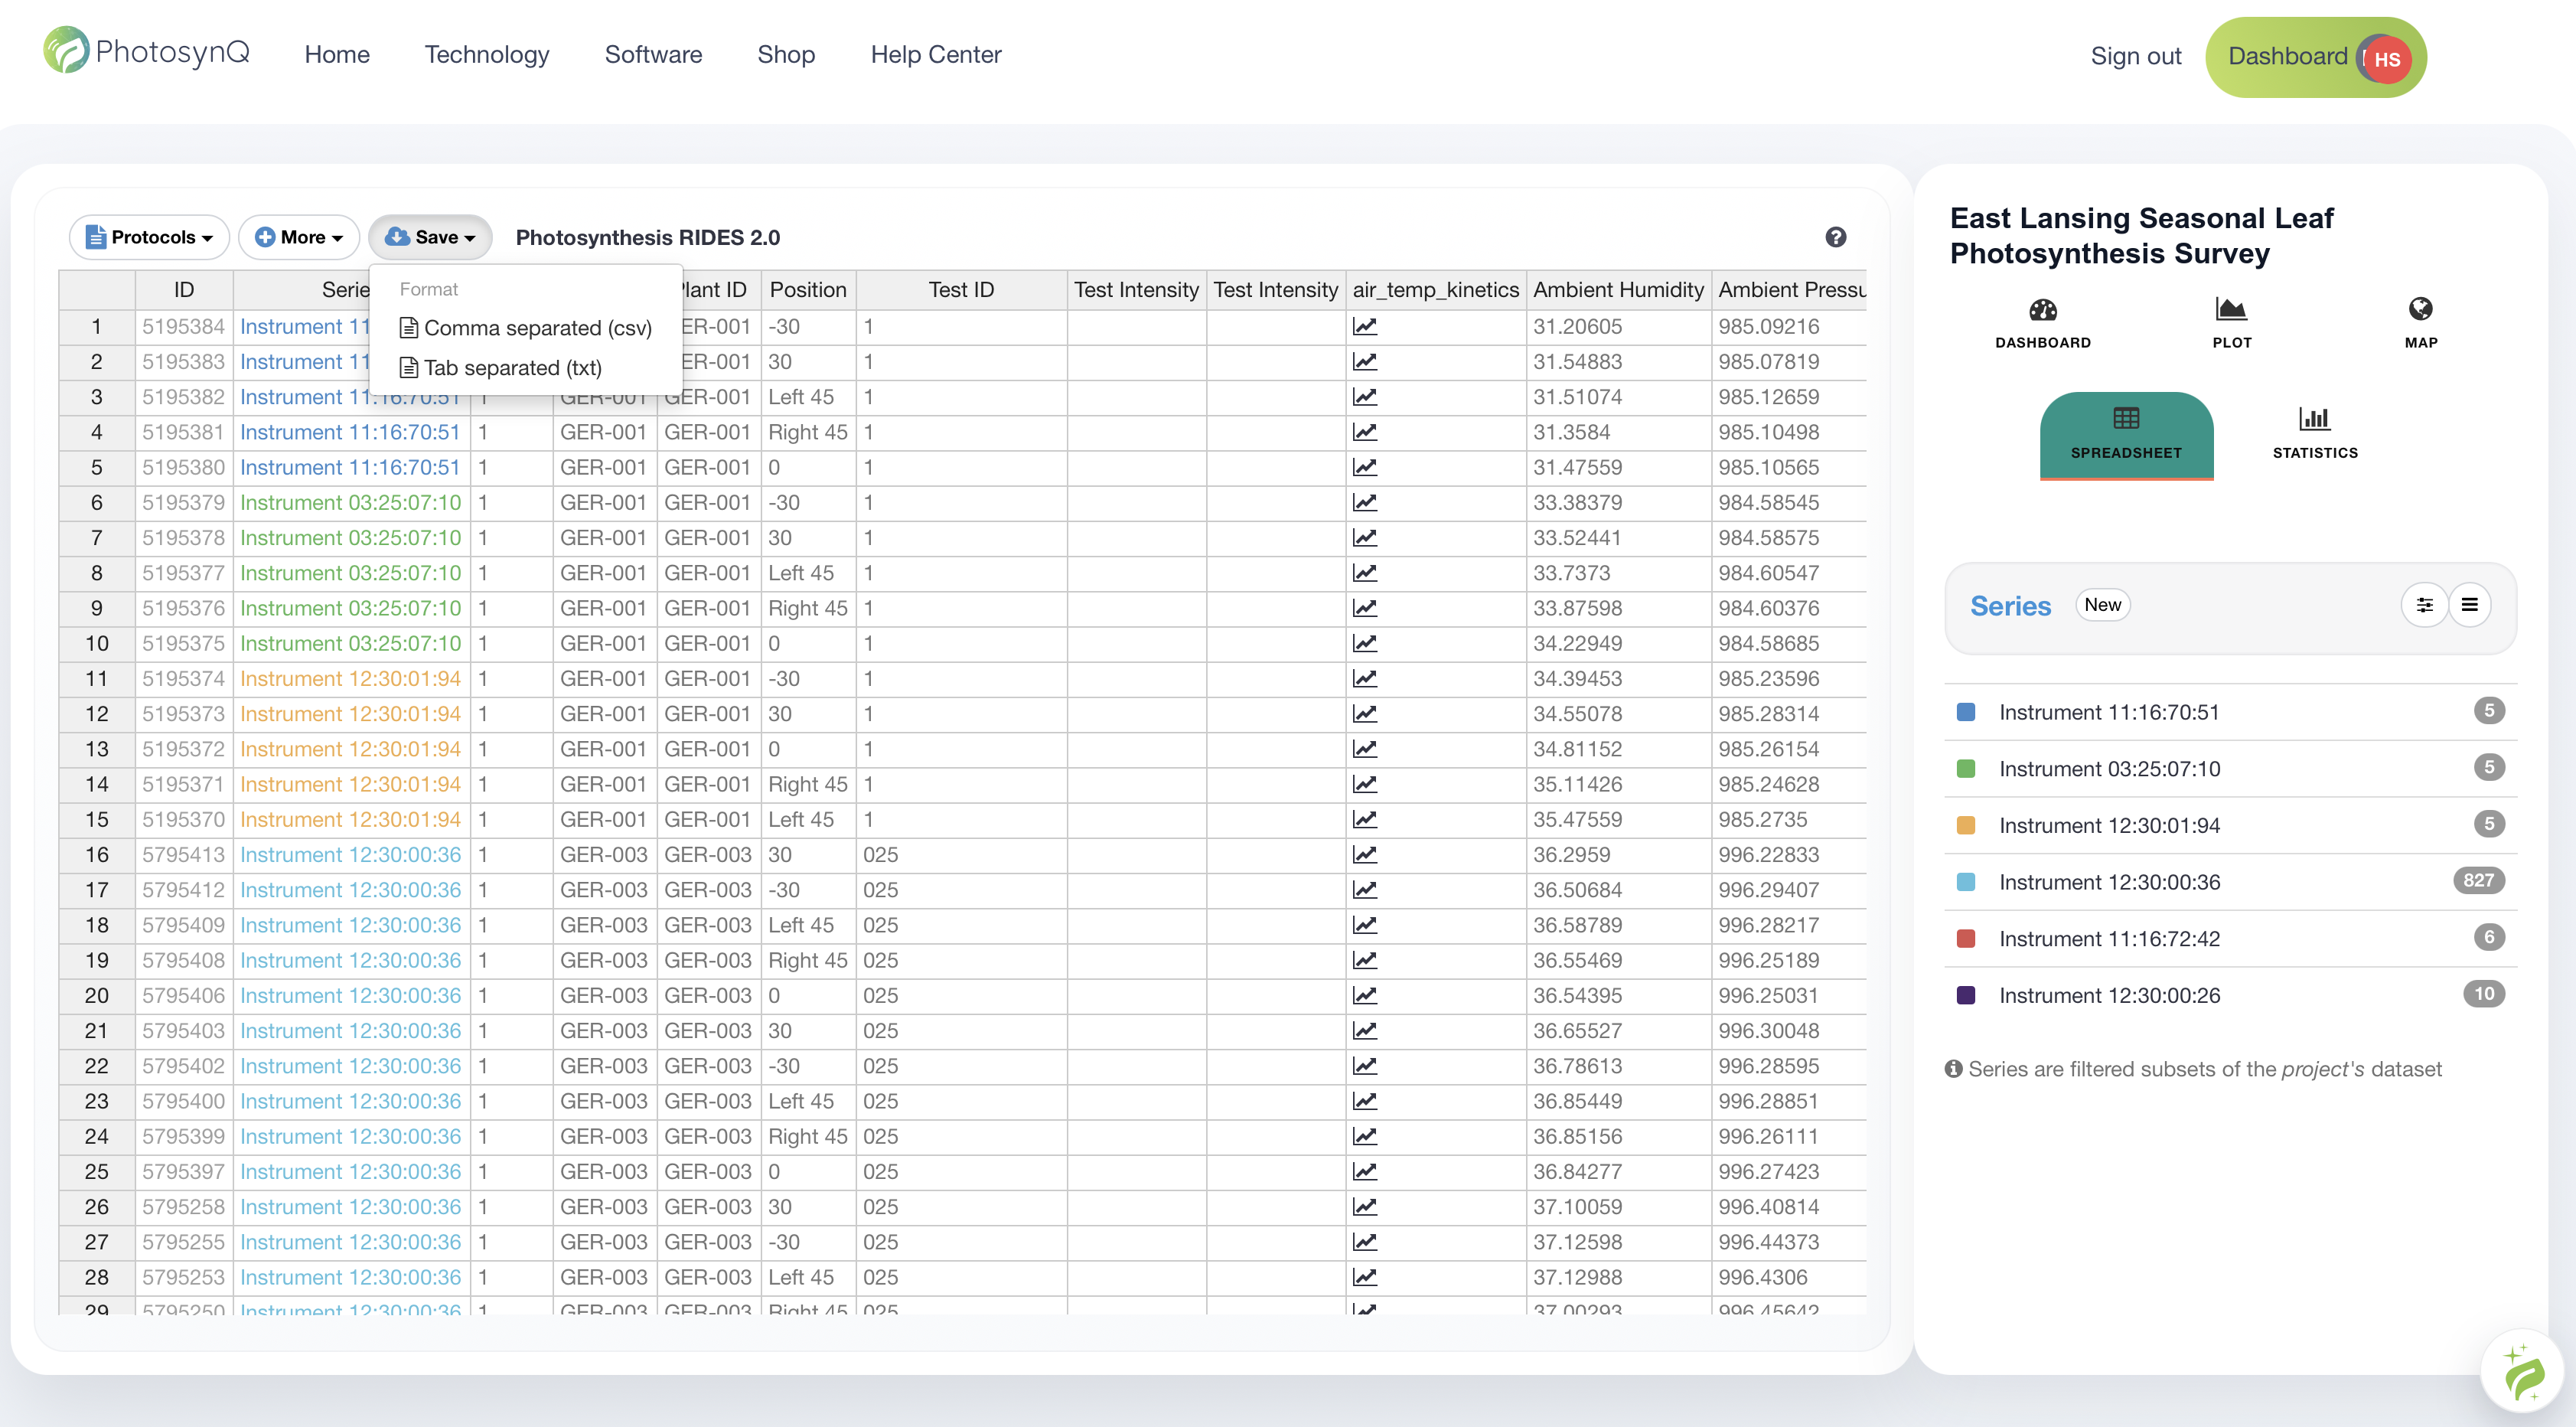
# Download Data
Select Save from above the spreadsheet and pick the format you want to use. Currently there are two options available:
- Comma separated (csv) - Values separated by a comma (standard format to open in Excel)
- Tab separated (tab) - Values are separated by a tab
# Special Functions
Some of the data in the spreadsheet columns is not just simple values but a number of values like a kinetic trace, an image,
a color or the measurement ID. These special cases are described below:
# Measurement ID (Measurement Details)
Click on the number in the ID column to navigate to the individual measurement. The measurement will be opened in a new tab.
Note
Measurement IDs are unique across the PhotosynQ platform, so they are helpful to specifically identify a measurement within your dataset.
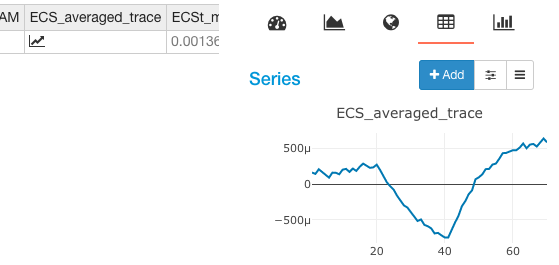
# Traces
Some columns may contain information that is not just a single value but a trace. An example would be a Phi2 fluorescence kinetic. In this case a trace icon is shown. When hovering over the icon the trace will be shown, overlaying the series menu on the right. Copying a trace from the spreadsheet, or saving the spreadsheet will return the values of the trace as a comma separated string.
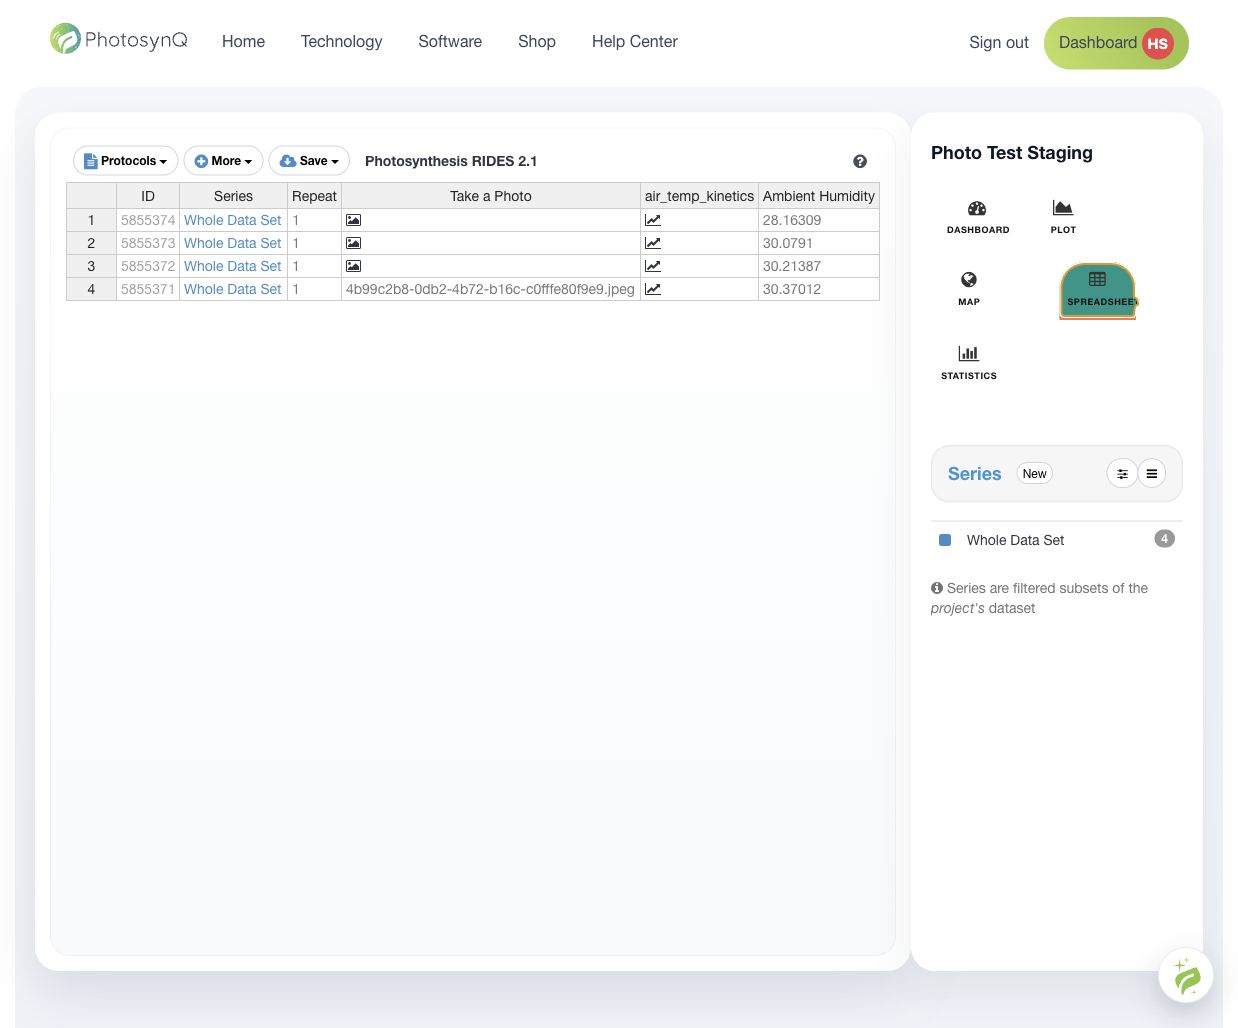
# Images
If a measurement has an image saved with it either as an additional note or as an answer to a Project question, an image icon is shown. When hovering over the icon the image will be shown, overlaying the series menu on the right. Copying an image from the spreadsheet or saving the spreadsheet will return the link to the image on PhotosynQ.
# Color
In some cases a color can be defined to represent a value. For example, these colors can be used in scatter plots. In the spreadsheet, the cell background is colored in this specific color. If the color is copied from the spreadsheet, the color will be returned as it was defined, for example: rgba(66, 139, 202, 1) (color in the spreadsheet ).
← The Map Statistics →