# Download data beta
While the data viewer allows you to analyze the collected measurements for a Project, it might become necessary to download the dataset and work in a different software. There are multiple ways to access the data. You can:
- Download a filtered dataset as a
.csvfrom the spreadsheet in the data viewer - Download the complete dataset from the Project page as a spreadsheet (.xlsx)
- Download the data as a
JSONformatted file (.json) - Use the Python or R libraries (external libraries) to import the Project dataset as a data-frame
Note
We are strongly recommending you view your data in the data viewer and flag data if necessary before downloading the dataset. This will ensure the highest quality and best results for your subsequent analysis.
# Availability
Downloads are not available to everyone. You have to be signed in and either a Project lead or a Project contributor to have access to those files.
# Data Viewer
When you are viewing the Project data using the data viewer, you can save your current selection in the spreadsheet as a .csv. See more in the section The Spreadsheet.
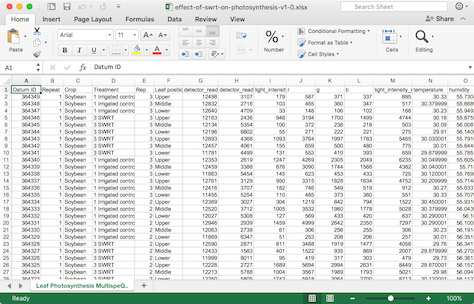
# Spreadsheet
The spreadsheet is structured the same way, it is in the data viewer. If you use multiple protocols, you will have multiple sheets. Each sheet will have the name of the protocol.
# JSON
When you download the data as a JSON you will receive more information than included in the spreadsheet. It contains the processed data, not the original, so certain fields, like the data_raw (raw trace) are not included. If you require this data, please use one of the external libraries.
[
    {
        "api_version": "3",             // Used API version
        "app_device": "x86-64",         // Device to record measurement
        "app_name": "PhotosynQ",        // App name
        "app_os": "mac",                // App OS
        "app_version": "0.3.2",         // App version
        "custom": {                     // Custom data (if imported)
            ...
        },
        "datum_id": 271164,             // Unique data point ID
        "datum_url": "https://...",     // Link to measurement
        "device_id": "82",              // Instrument ID
        "firmware_version": "0.47",     // Instrument firmware version
        "location": [                   // Attached location
            42.7369792,                 // longitude
            -84.4838654                 // latitude
        ],
        "status": "submitted",          // Measurement status (submitted/flagged)
        "time": 1463001730187,          // Unix timestamp in ms (UTC)
        "time_offset": 240,             // timezone offset in min (optional)
        "user_answers": {               // user answers to Project Questions
            "11292": "red"
        },
        "user_id": 7,                   // User ID (took measurement)
        "sample": [                     // Results from measurement protocol
            {
                "time": 1463001730225,  // Unix timestamp in ms (UTC)
                "protocol_id": "475",   // Protocol ID
                ...
            },
            ...
        ]
    },
    ...
]
# External libraries
Just select External Libraries from the download options on the Project page. This will bring up a modal dialog with code examples for Python and R. Simply copy the code into your script to generate a data-frame.
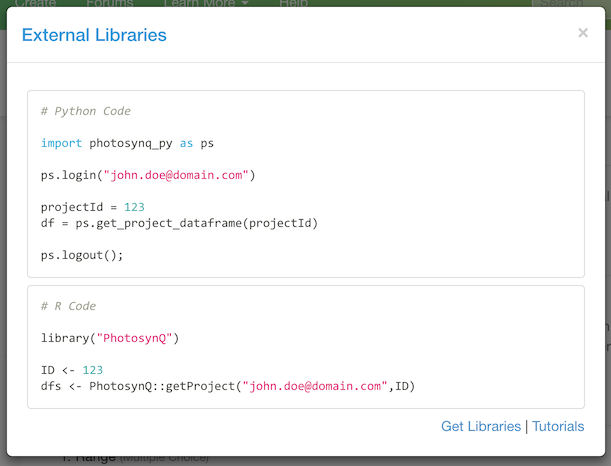
For more on how to use the libraries, see the links to the software (opens new window) page and tutorials here and at the bottom of the dialog.