# Data Issues
The standard PhotosynQ photosynthesis Protocols include issue warnings. Treat a warning as a reason to review the acquisition, not as automatic evidence that the biological result is invalid. Define rejection rules before collection and apply them consistently.
Tip
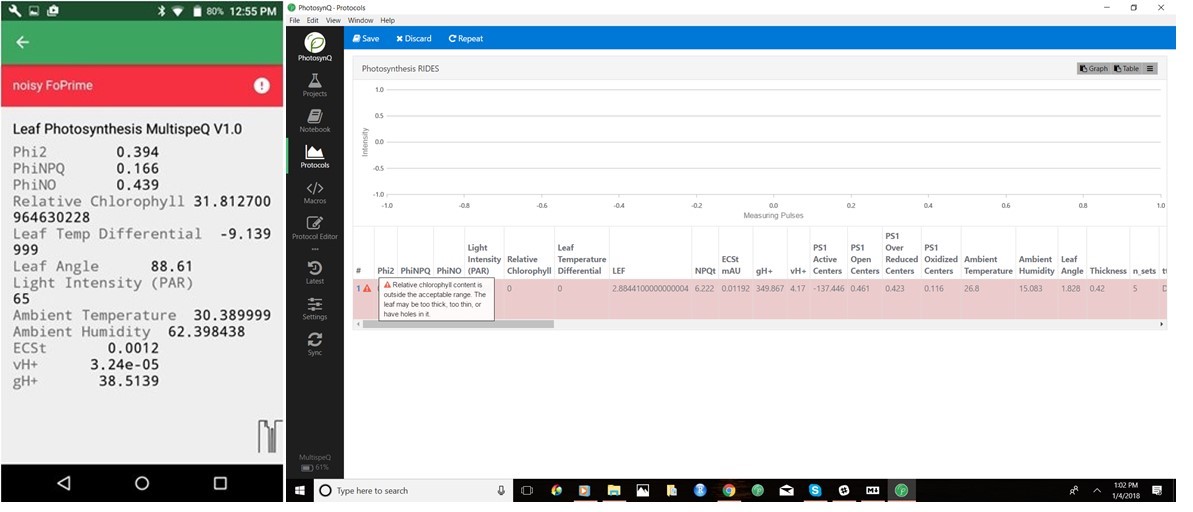
The Leaf Photosynthesis MultispeQ v1.0 protocol also has yellow informational warnings. Review them according to the study's documented quality-control rules.
# Common causes of issue warnings
- The device or leaf was not held steady throughout the measurement. This can be due to taking measurements in windy conditions or the data collector's hand shaking.
- The leaf did not fully cover the light guide. This is especially problematic for absorbance measurements such as relative chlorophyll content. This often results in a warning message stating that the relative chlorophyll content is either very low or out of the expected range.
- The leaf was dead or dying. Leaves in this condition can cause the Phi2, PhiNPQ or PhiNO values to be out of the expected range. This may be a completely valid measurement, or a measurement that should be discarded.
# Identify measurements with issue warnings in the data explorer?
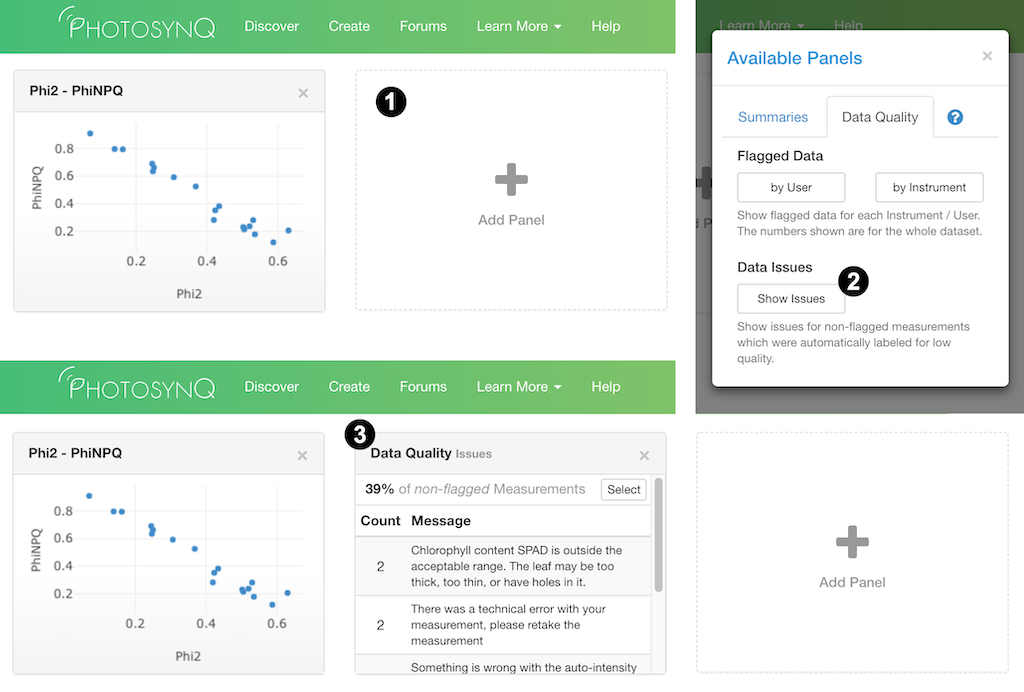
- We have added a default panel on the dashboard labelled Data Quality - Issues that provides information about how many of the non-flagged measurements have issues. If the panel is not visible, you can add it to your dashboard by:
- Select Add Panel in the dashboard
- Select the data quality tab
- Select the Show Issues button below Data Issues
Note
Only non-flagged measurements with issues will be displayed on the dashboard. Once you have flagged a measurement, it is hidden from normal data viewing and analysis unless you check the Include flagged datasets box in the Add Series tab
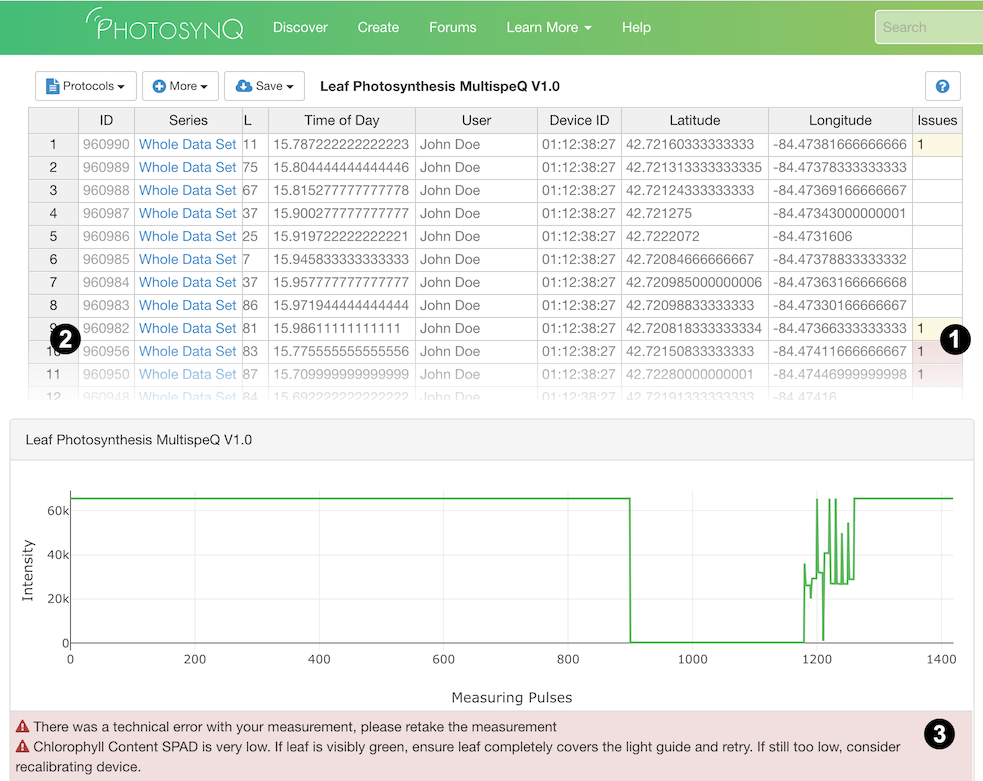
In the Spreadsheet view, there is an Issues column that will display how many issues exist for a given measurement.
In the single datum view, any issues will be present as a red bar above the measurement results.
# Adding issue warnings to Macros
Macro authors can return warning and danger feedback for protocol-specific quality checks. See Coding and Functions for the maintained API and examples. Validate thresholds with representative known-good and known-problem measurements before using them as collection or exclusion criteria.