# Statistics
A very basic set of statistical tools for your Project data analysis.
# View the Spreadsheet
- Select the Statistics from the right menu underneath the Project name.
- Choose the type of statistics you wish to perform and select the significance level.
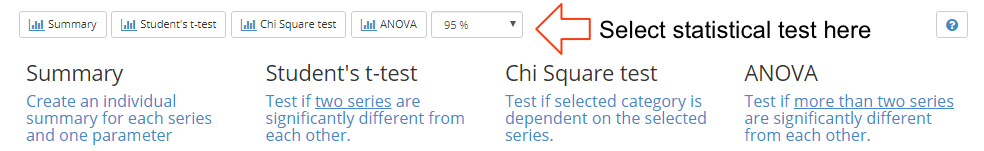
# Summary
- Pick the parameter you want the statistical summary generated for and click on Show Summary.
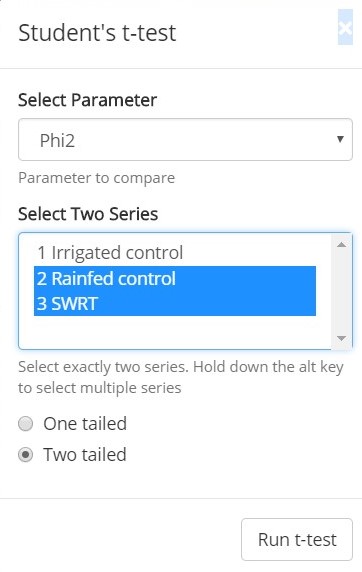
# Student's t-test
- Pick the parameter and the two series you want to compare.
- Select one-tailed or two-tailed, depending on your dataset.
- Click on Run t-test to show the results.
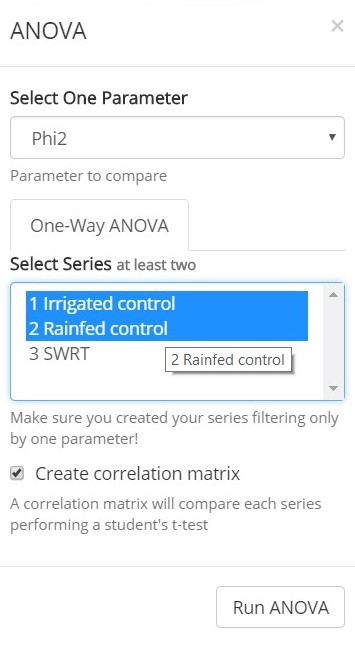
# ANOVA
- Pick the parameter and at least two series to compare.
- Check Create correlation matrix to generate a table of t-test.
- Click Run ANOVA.
# Chi Square test
Pick the parameter that you want to test for.
Note the parameter must be a categorical variable.
Pick at least 2 series to compare.
Click Run Chi Square test.