
# Create / Edit a Macro
If you want to analyze a measurement using your own calculation, utilize a Macro to do the calculation for you. A Protocol has a Macro automatically associated which will calculate all parameters derived from the measurement immediately after the measurement is done. When the measurement is saved for a Project, the raw measurement is sent to the cloud where the macro will do the calculations again. If a Protocol/Macro gets changed, all values will be recalculated again.
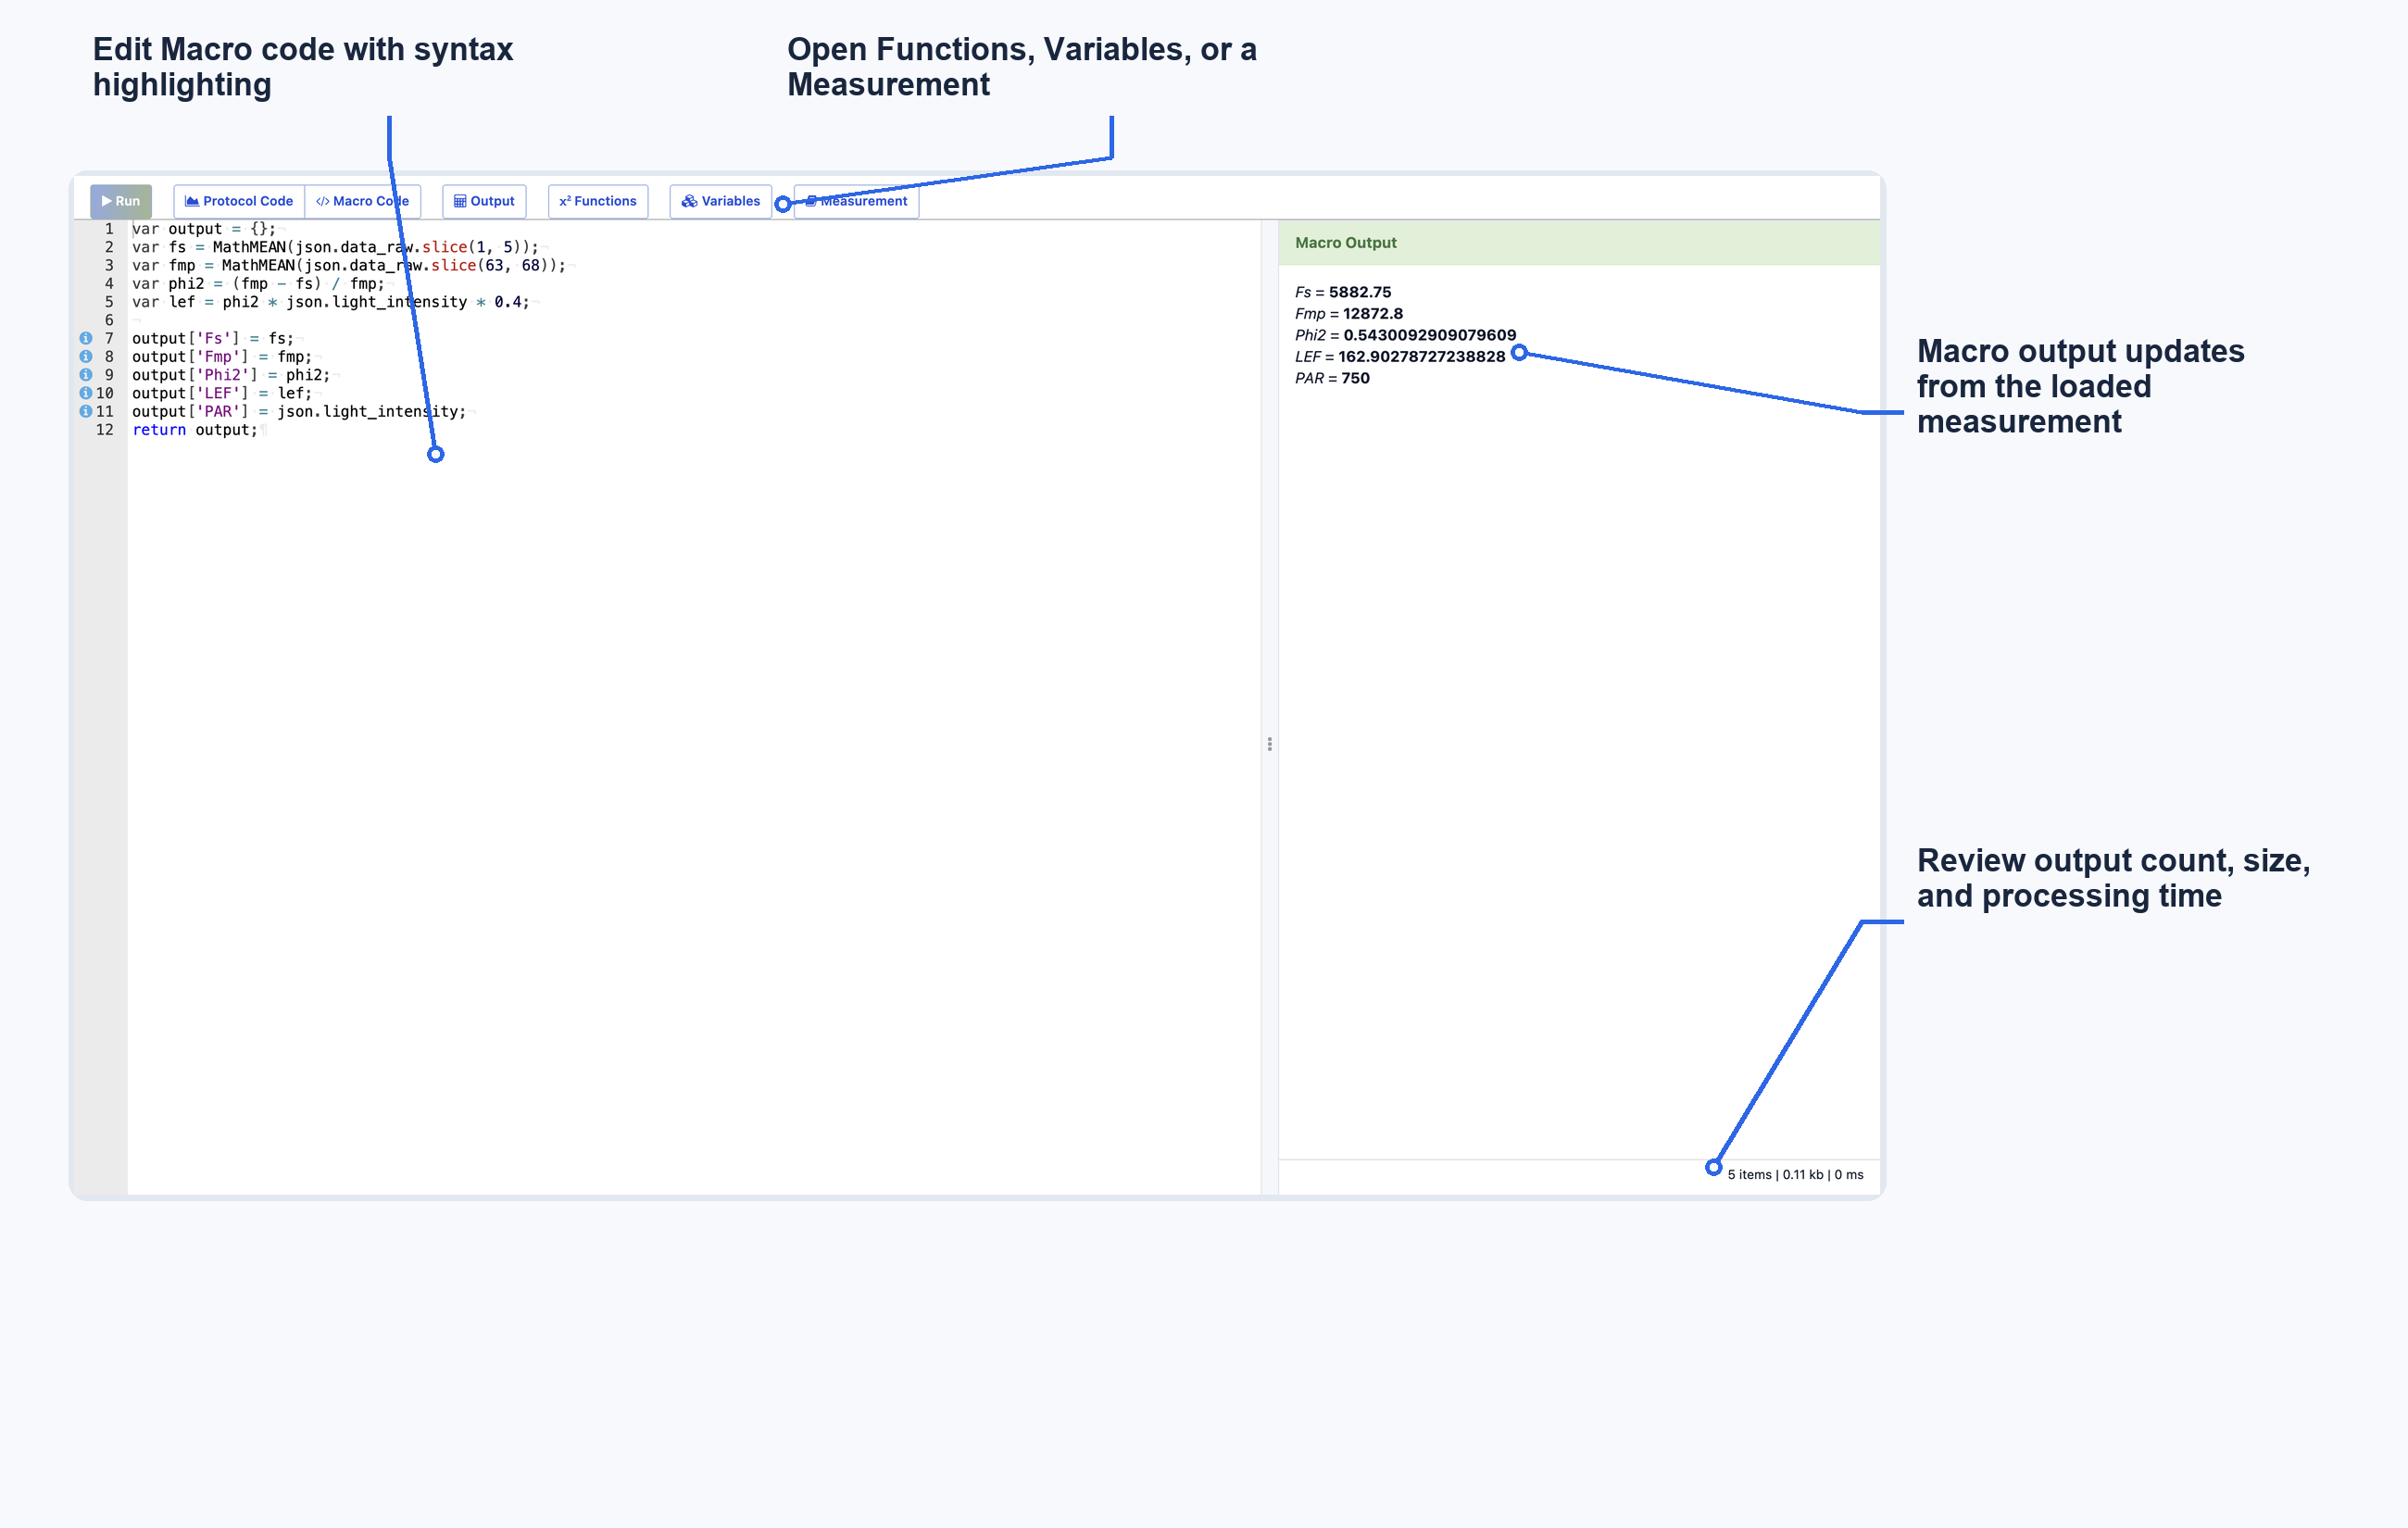
# Create a Macro
- Make sure you have the Desktop Application installed and you are signed in.
- Select the Protocol you want to create the Macro for.
- Attach a measurement to the Macro
- Select a measurement from the Notebook that was saved using the Protocol the Macro will be created for.
- Run the Protocol from the Protocol Editor and use the "Add To Editor" button after the measurement is done.
- Start coding...
If you need more help on how to get started, please look at the example below.
# Edit a Macro
You can change or extend Macros connected to a Protocol at any time.
- Select the Protocol you want to update the Macro for.
- Click on Edit in the sidebar.
- Make your changes to the code.
- Select Save... from the File menu or use the shortcut Ctrl/⌘+S.
- Update the description if needed.
- Save the changes by Save.
# After Macro Updates
When updating a Macro for a Protocol that is used in a Project, the update will impact the data already collected. When opening the Project on the PhotosynQ website to view the data, you will be asked if the data should be reprocessed. This is only available to the Project Lead.
# Troubleshooting
If you have issues saving the macro, make sure you check these things first:
- When a Macro is done, make sure the output box is green, indicating that there was no error.
- Check several different measurements to make sure the Macro code works with different traces/numbers.
# Example - Calculating Photosystem II efficiency
In the protocol example we built a protocol to measure photosystem II efficiency. Now we can build a simple macro to automatically calculate it every time you take a measurement.
# Initial Code
/**
 * Macro for data evaluation on PhotosynQ.org
 * by: John Doe
 * created: June 4, 2018 4:00 PM
 */

 // Define the output object here
var output = {};

// Check if the key time exists in json
if (json.time !== undefined){
    // Add key time and value to output
    output.time = json.time;
}

// Return data
return output;
# Accessing the recorded Trace
In order to calculate the parameters Fs (steady state fluorescence) and Fmp (maximum fluorescence), access the recorded fluorescence trace from Variables. Select data_raw to display the graph and its JSON path. Hover over the graph to inspect individual pulse values. Drag across the graph to select a region, then use the range action to insert a slice such as json.data_raw.slice(63,68) into the code. The pre-defined MathMEAN(array) function can then calculate the mean of that range.
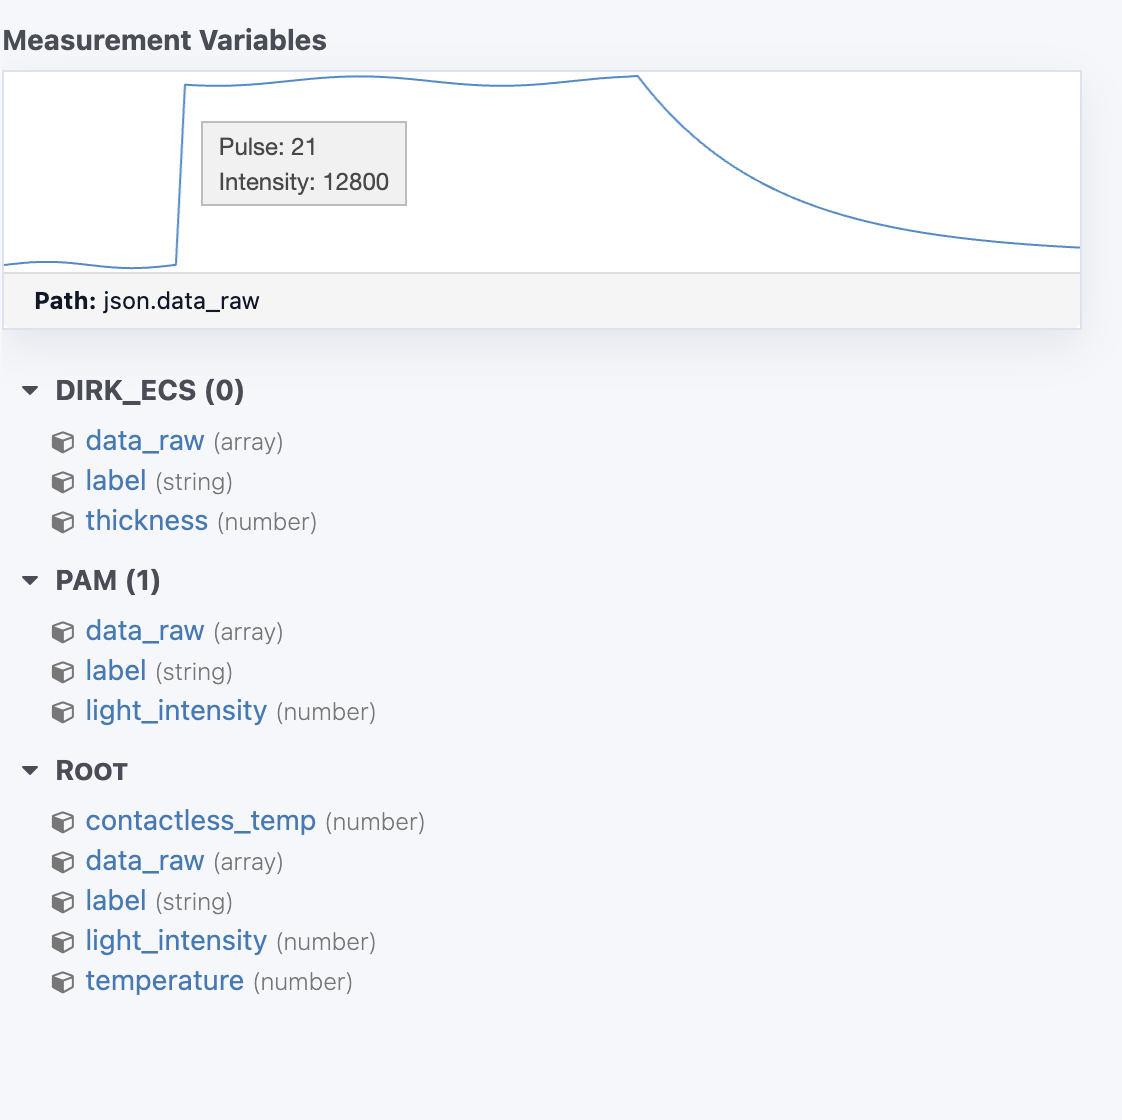
var fs = MathMEAN(json.data_raw.slice(1,5));
var fmp = MathMEAN(json.data_raw.slice(63,68));
# Deriving values and adding them to the output
Now we can calculate Phi2 and LEF. For LEF we also need the light intensity. We can insert the light intensity by selecting light_intensity from the variables in the top menu.
# Equations
(1)
(2)
# Equations as Code
var phi2 = (fmp-fs)/fmp;
var lef = phi2 * json.light_intensity * 0.4;
# Defining the Macro Output
Finally we can return the results by adding the calculated values to the output object.
output['Fs'] = fs;
output['Fmp'] = fmp;
output['Phi2'] = phi2;
output['LEF'] = lef;
output['PAR'] = json.light_intensity;
# The Final Macro
/**
 * Macro for data evaluation on PhotosynQ.org
 * by: John Doe
 * created: June 4, 2018 4:00 PM
 */

//Define the output object here
var output = {};

var fs = MathMEAN(json.data_raw.slice(1,5));
var fmp = MathMEAN(json.data_raw.slice(63,68));

var phi2 = (fmp-fs)/fmp;
var lef = phi2 * json.light_intensity * 0.4;

output['Fs'] = fs;
output['Fmp'] = fmp;
output['Phi2'] = phi2;
output['LEF'] = lef;
output['PAR'] = json.light_intensity;

//Return data
return output;
# Output
Fs = 5817.25
Fmp = 13056.6
Phi2 = 0.554
LEF = 3.770
PAR = 17
# Example - Advanced Macro
When building a Macro for a Protocol using the _protocol_set_ command, start with the same structure as the previous Macro example. A Protocol Set changes how the returned parameters are accessed.
# The json.set Object (Variables)
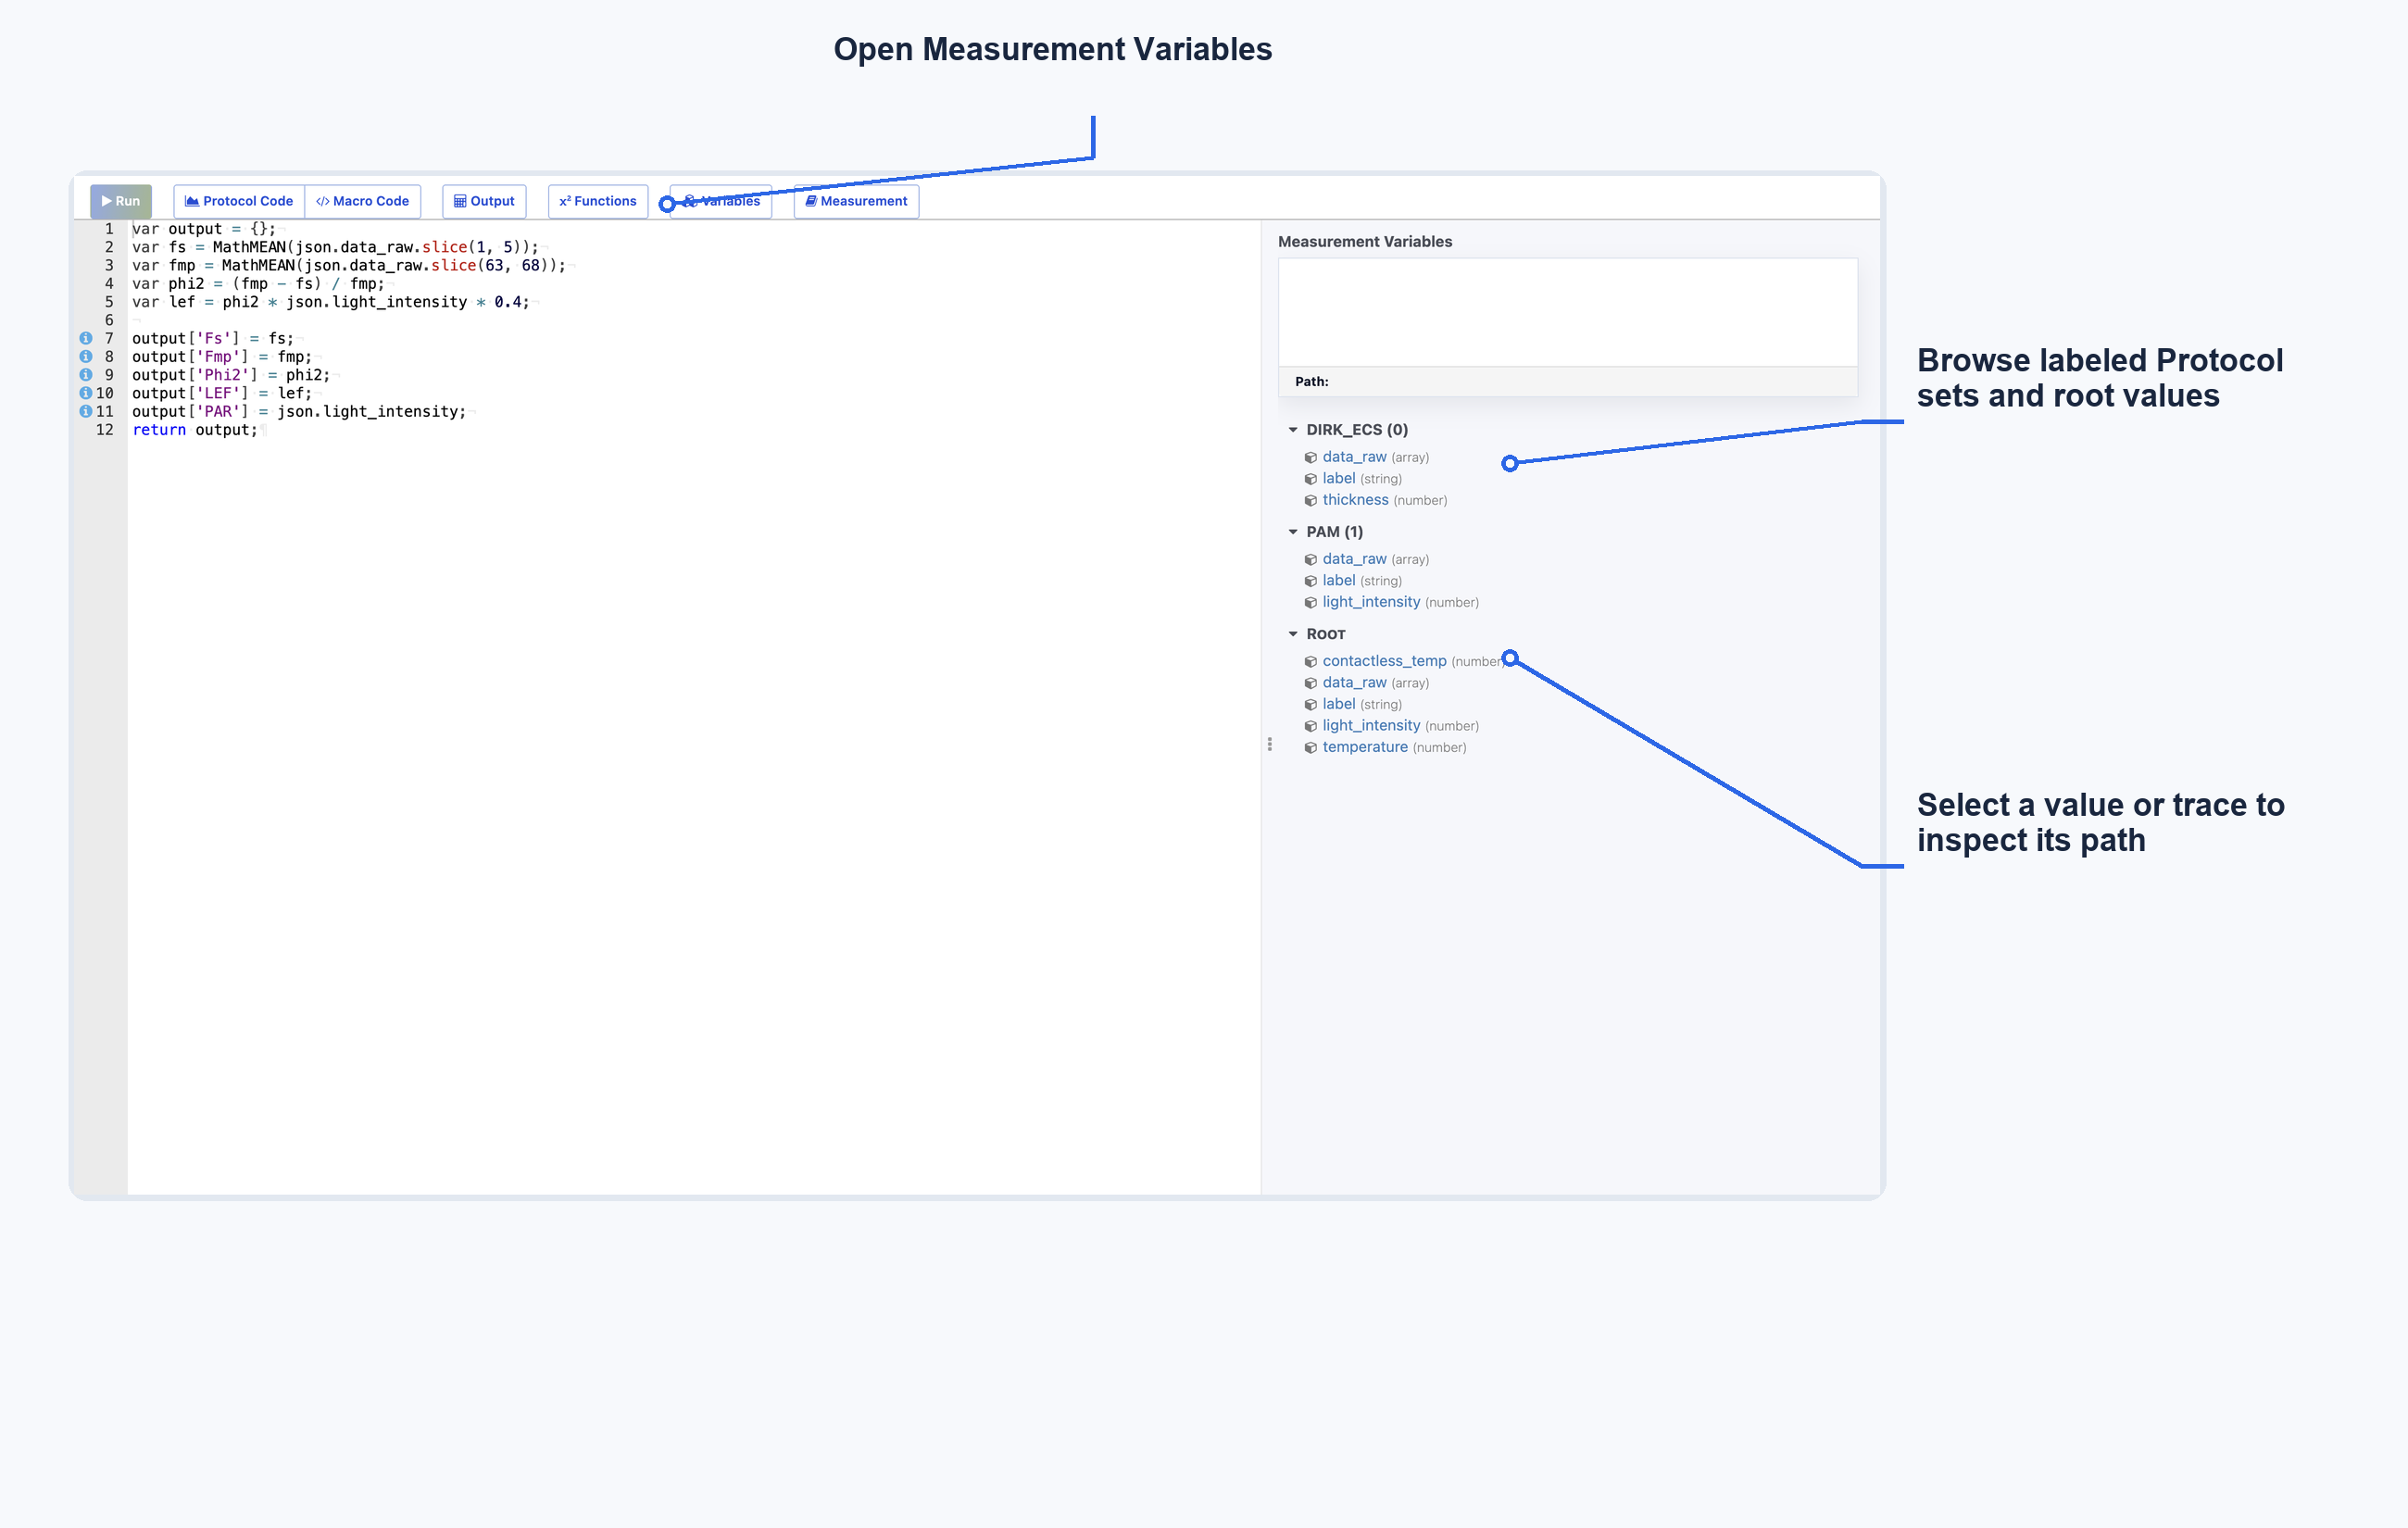
The object json is no longer holding all the measured Parameters as shown in the previous tutorial. Instead it has a key called set with all Protocols from the Protocol Set. Since json.set is an array of Protocols, you have to provide the index as well. If you want to access the third Protocol for example, you simply use json.set[2]. This can get a bit confusing when you are using multiple Protocols inside your Set. To make it more accessible, the Macro Editor provides a tree view for variables in each Protocol. Select Variables from the top toolbar to show it. When selecting a variable, the value and path (for example, json.set[2]) are shown. If you use the label command inside each Protocol, the label appears in the tree view and makes access easier. Double-click a variable to insert its path into your code.
# Simple Protocol Set Example
/**
 * Macro for data evaluation on PhotosynQ.org
 * by: John Doe
 * created: June 4, 2018 4:00 PM
 */

 // Define the output object here
var output = {};

// Check if the key time exists in the third protocol of the set
if (json.set[2].time !== undefined){
    // Add key time and value to output
    output.time = json.set[2].time;
}

// Return data
return output;
# Multiple Detectors
In the previous example for a simple Macro only one detector was used. But it can happen, that a measurement requires multiple detectors. This can be accomplished in two different ways as described. The number of data-points within the data_raw element in both examples the same, but the way the data is collected is fundamentally different (see Detectors - Output Examples).
# One Detector per Pulse-Set
The detector readings in this example are sequential, so the first 20 pulses are recorded with detector 1, the next 20 pulses are recorded with detector 3. In the data_raw array, the first 20 values are the readings from detector 1, the next 20 from detector 3. Using the JavaScript Array slice() Method (opens new window) the two readings can be easily separated in the analysis. Keep in mind, that the first value has the index 0.
# Two or more Detectors per Pulse-Set
In this scenario, the detector readings alternate between detector 1 and detector 3. The total number of pulses will be 20, but since the detectors now alternate, the returned values in data_raw alternate as well. To separate the output of the two detectors you can use the provided function ArrayNth. The alternative is to loop through the data_raw array and extract the values yourself.